A 40-second sample scene in a faceless finance-explainer style: kinetic text, charts built from real data, a counter that lands, and SHIFT, an optional deadpan host bot that talks along with the narration.
The three things a data-driven explainer channel lives on, shown in the scene itself.
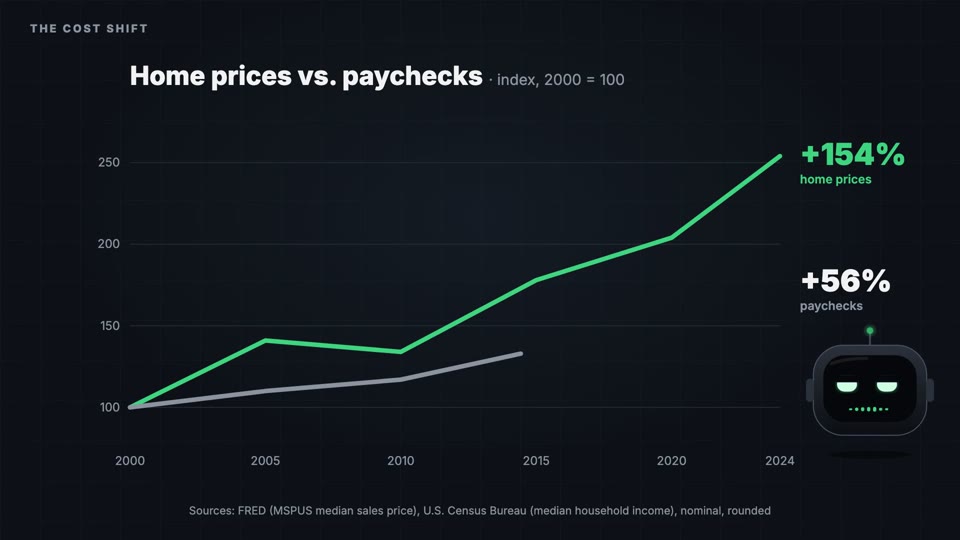
ChartsCharts are generated from the source numbers (CSV or sheet), not drawn by hand. The line ends where the data ends.
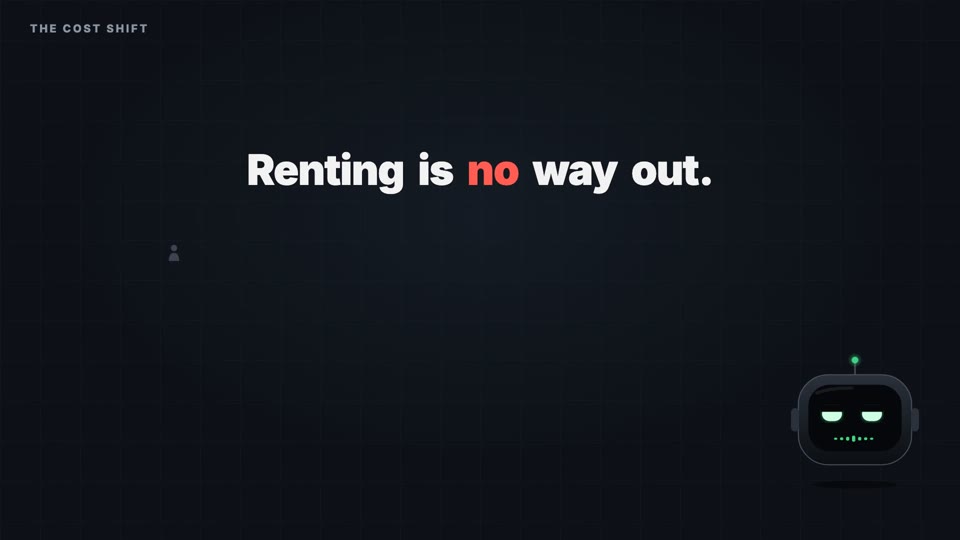
PacingKinetic text, icons, counters and charts change on the spoken word. No static screens.
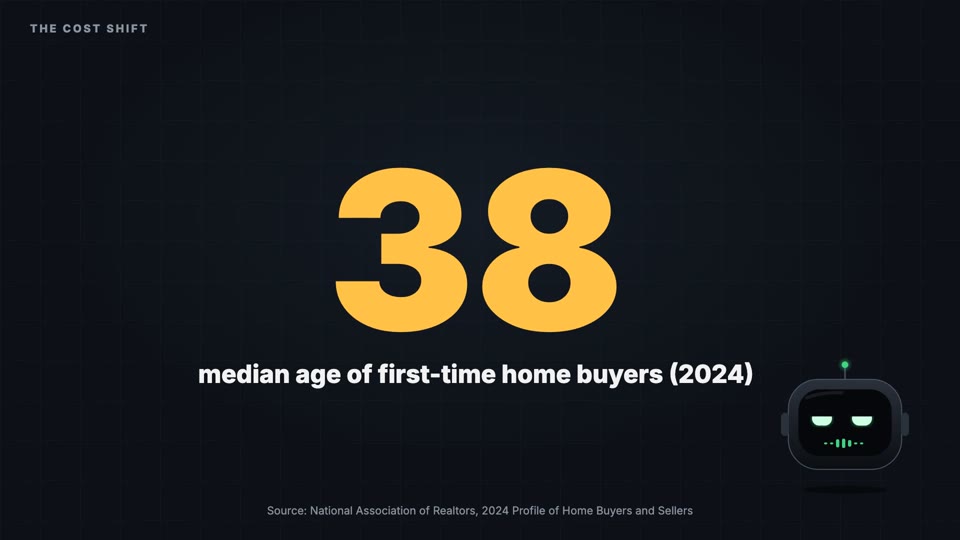
The big numberCount-up, one beat of stillness, one context line, then a small stamp. No confetti, no zoom blur.
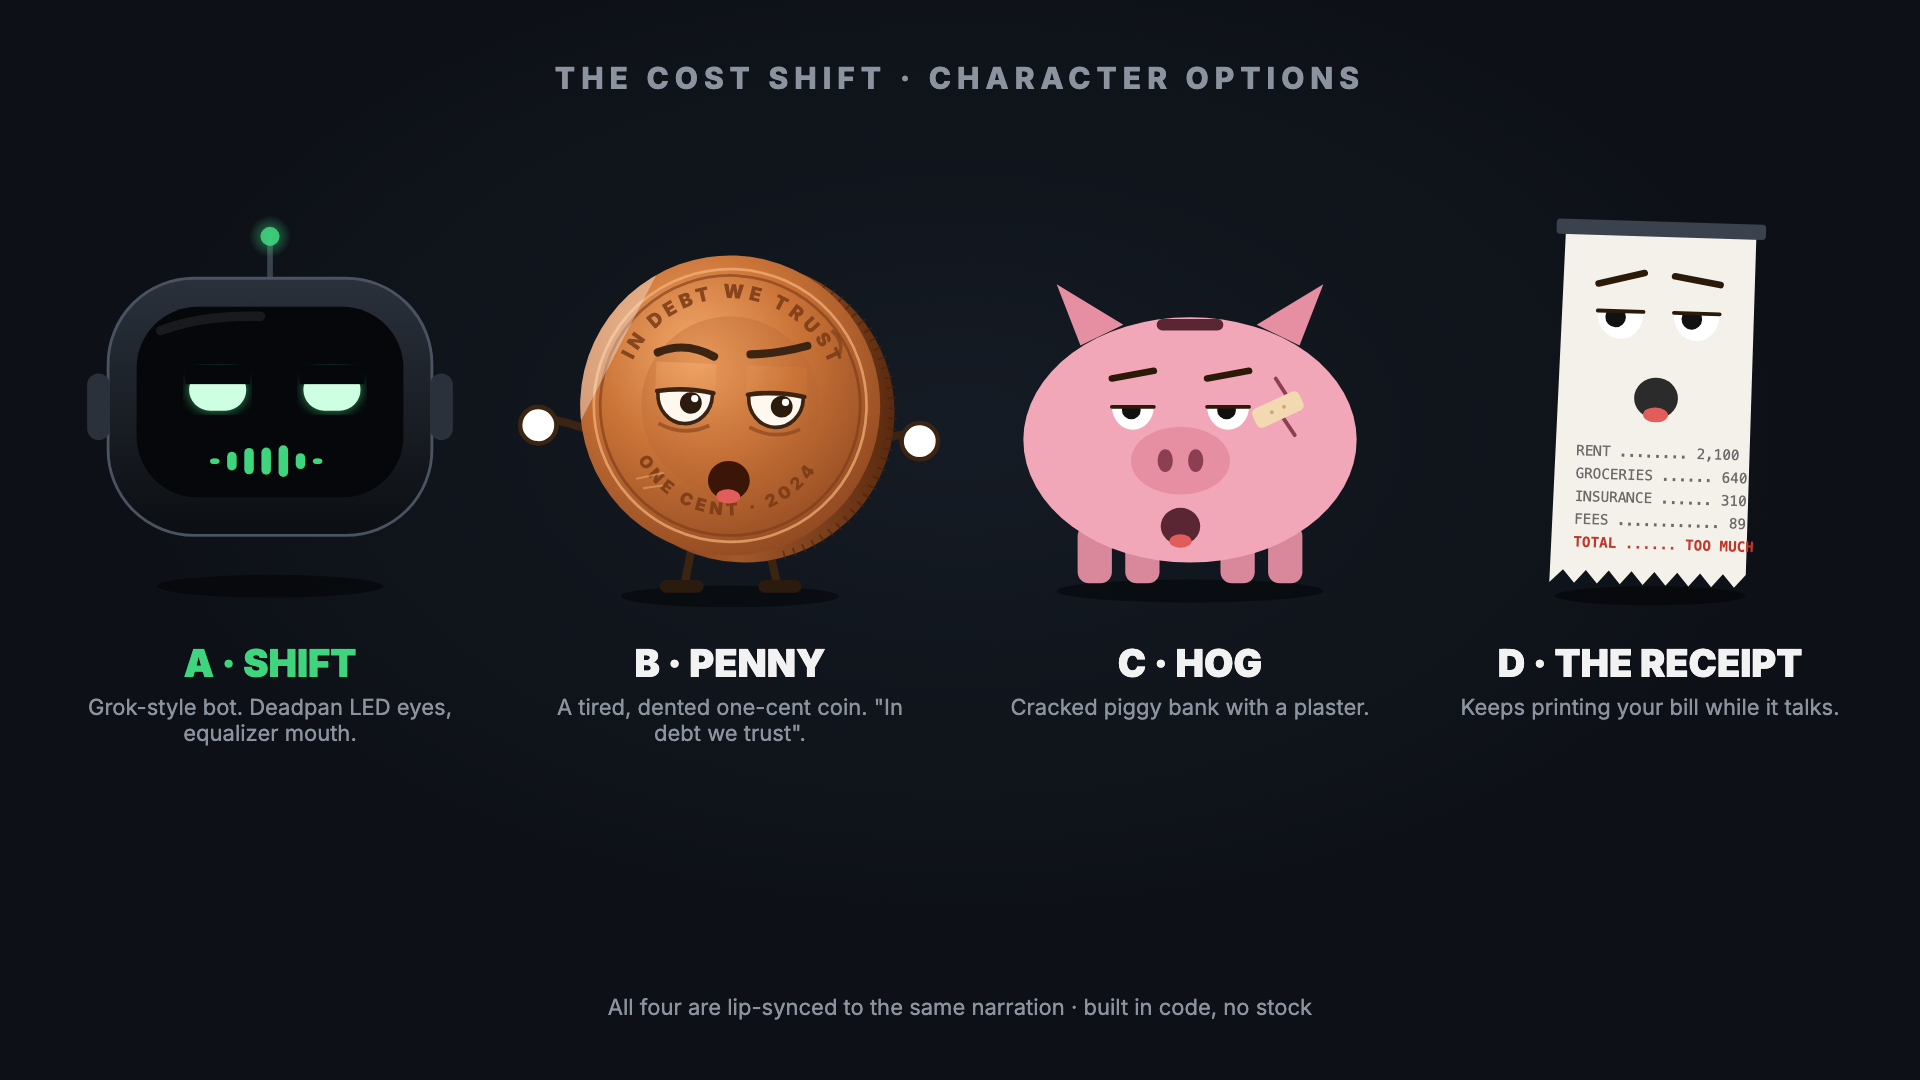
A faceless channel can still have a face. Four options, all lip-synced to the narration automatically. SHIFT (A) is in the sample scene. Pick one, or none.
Built in code with Remotion, so a new chart means new data, not new keyframes. That is how a 13-minute video stays fast to produce, week after week.
Script with visual cues, chart data, finished narration.
The narration is measured word by word. Every visual cue snaps to the spoken word.
Charts, maps, counters, icons and transitions in the channel style, built once, reused every week.
Every chart value is read straight from the source file, and each source sits on screen.
Licensed music bed plus subtle whooshes and pops, mixed to −14 LUFS.
MP4 master, project files, licence sheet. Shorts cut on request.
Two more samples with data visuals and maps.
Documentary motion pack sample: lower third, stat card, timeline, ranking.
Animated map in an explainer style, built in Remotion with D3.